


In ‘’green’’ chemistry, we anticipate the progression of a field once dominated by research to one dominated by research, development, and commercial scale industrial production.
It is thus essential to have realistic estimations of the sizes of markets in the short-term (less than 1 year) and medium-term (1-5 years). Certain market life-cycles have become shorter over time including chemicals for electronics which are now seeing 1-2 year life cycles.
These estimates must be done by systematic and detailed questioning of experts as well as prospective customers. The synthesis of the feedback is crucial to strategy marketing and business plans.
However, these market analyses and methodologies may be subject to “pitfalls” which can heavily impact future decisions.
- Pitfall #1: interpolation of macro data versus aggregation of micro data
Interpolations and extrapolation of a “macro” market are often made to estimate a “micro” market by neglecting the sub-markets, which are often niches.
Mathematically, the market size is estimated by use of averages calculated on a global market without considering the sub-markets; this may generate inaccuracies in the data synthesis. For example, customers and prospective customers are asked the following two questions:
- What quantity of additives will you buy for your production in 2015?
- What percentage of price increase would you be willing to accept to replace your current product?
These questions are important because quantity and price are the two crucial factors for forecasting sales revenues and creating a business plan.
The interviewed population generally consists of sub-populations with very different behaviors. Consider the following two sub-sets of customers/prospective customers:
- High volume customers in sub-market 1;
- Low volume customers, often serving niche applications, in sub-market 2.
The table below provides data for sub-markets 1 and 2:

The consumption average per company in the overall market is 70.1 tons/year. The consumption average per company in sub-market 1 is 94.7 tons/year. Lastly, the consumption average per company in sub-market 2 is 12.7 tons/year. It is easy to imagine the consequences of assuming a consumption value of 70.1 tons/year per company as an extrapolation basis.
This pitfall is even more impactful since products are usually not strictly identical between sub- markets.
Furthermore, the average of the percentage price increase for in company in the overall market is 4.1%, the weighted average by quantity is 1.82%. The weighted average by quantity for the sub- market 1 is 1.3% and for sub-market 2 is 10.1%.
This example shows that market size estimates differ significantly depending on the calculation method. This is especially true if a variety of regional or unidentified markets within a global market exhibit different purchasing behaviors. Failure to perform a segmented analysis upstream may result in severe inaccuracies for market estimates.
- Pitfall #2: Failure to consider standard deviation
The standard deviation represents the amount of variation in the data with respect to the average. This value helps to determine the level of uncertainty in the data.
The same strategic decisions should not be made regarding a customer with a sales forecast of 12.3 tons/ year +/-1 ton versus 12.3 tons/ year +/-9 tons.
With consideration for standard deviations, prospecting efforts and industrial assets can successfully be managed to optimally plan for the expected consumption variation.
- Pitfall #3: performing interviews with experts without a statistical approach
The usual approach is to interview industry experts, who can often speak with accuracy to their market. For example, experts are often interviewed for insight into a specific application or region.
Another approach is to understand the market is to define its structure and conduct interviews with a systematic and proven methodology.
To illustrate this point, consider the following example. Ten experts are interviewed in a market of 250 companies and are asked to quantify the market size.
Given an interval of imprecision equal to +/- 20%, the level of confidence is 60%.
In other words, the probability of a market estimated at 1,320 tons/year (+/- 20%) falling within the range of 1,056 and 1,584 tons/year is 60%. By maintaining the same interval of imprecision (+/- 20%), the level of confidence can be increased to 95% by performing more interviews thus increasing the sample size of data.
- Pitfall #4: neglecting qualitative data
Interviews with experts and customers may yield qualitative information which can only be valuable if analyzed with the adapted tools.
Conclusion: utilizing the proper statistical approach will maximize success in the future
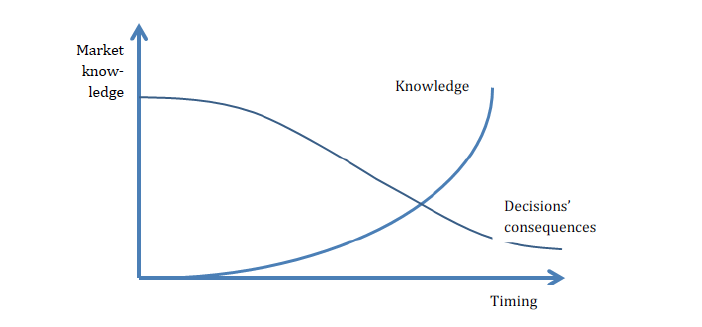
The choice of the analytical methodology can fundamentally shape future strategic business decisions. Awareness for common pitfalls and employment of a proven methodology can avoid some misjudgments and errors in strategic marketing. This concept is illustrated in the figure below.


