


Analysis of the Top 100 Chemical Companies and the Relationship Between R&D Investment & Revenue.

Table of contents
• Introduction
• Overview of the Global Top 100 Chemical Companies
• How are patent activity and revenue correlated?
• How does R&D expenditure correlate with revenue?
Introduction
In this article, we study the top 100 global chemical companies by revenue, and specifically the relationship between their sales of chemicals and patent publication performance in 2018. The specific parameters that are used to frame the analysis are chemical sales per 1,000 employees, the number of published patents per 1,000 employees, and R&D expenditure.
Overview of the Global Top 100 Chemical Companies
Based on 2017 chemical sales rankings and major financial data for 2018 disclosed by various chemical companies, Daydream selected the top 100 chemical companies according to chemical sales revenue in 2018. For most companies, the latest data came from calendar year 2018, while the remaining companies reported different 12-month periods.
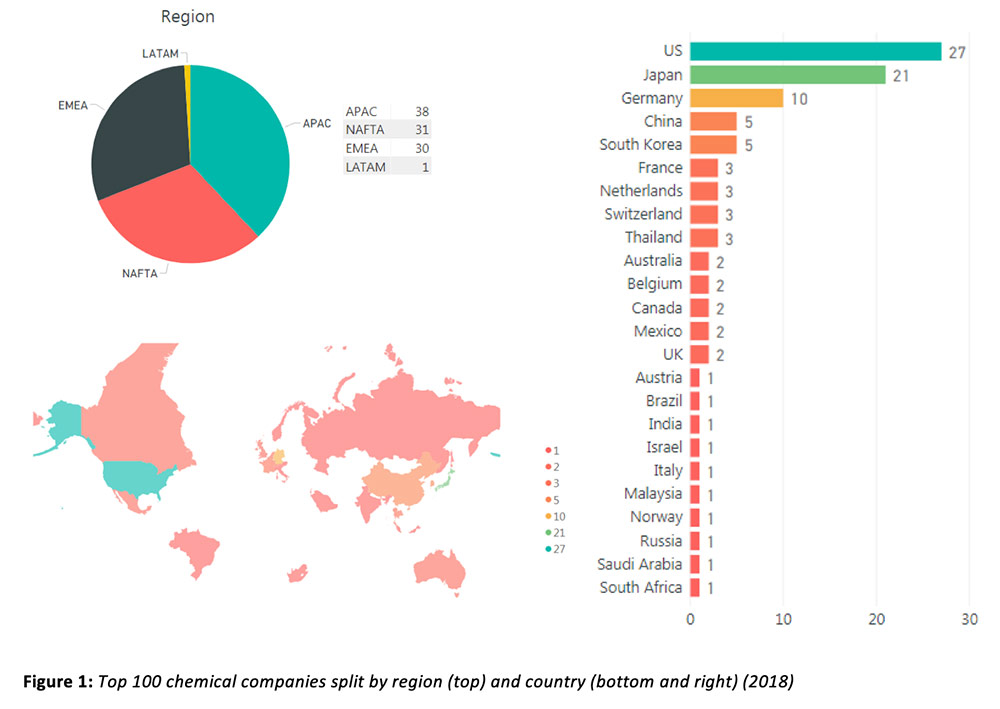
According to the analysis of the Daydream top 100 chemical company list, the regional distribution of the top 100 companies worldwide is fairly even. APAC (Asia-Pacific) leads the way, with 38 of the top 100 headquartered there, followed by North America (NAFTA) with 31 companies and EMEA (Europe, the Middle East & Africa) with the remaining 30. Together, the top 100 revenues account for a total of ~$1.252 trillion in chemical sales in 2018. The regional distribution is depicted in Figure 1.
The following table (Table.1) shows the Top 100 list and related figures.
| Rank | Company name | 2018 Chemical sales (USD Billions) | No. of patent published |
| 1 | Dow Dupont | 85.98 | 2938 |
| 2 | BASF | 70.49 | 4066 |
| 3 | Sinopec | 68.15 | 2191 |
| 4 | SABIC | 42.12 | 1655 |
| 5 | LyondellBasell Industries | 35.45 | 21 |
| 6 | ExxonMobil Chemical | 32.44 | 771 |
| 7 | Mitsubishi Chemical Holdings 1 | 28.45 | 687 |
| 8 | INEOS a | 28.11 | 182 |
| 9 | Formosa Plastics a | 27.62 | 33 |
| 10 | PetroChina | 24.85 | 614 |
| 11 | LG Chem | 23.67 | 3348 |
| 12 | Air Liquide | 23.16 | 356 |
| 13 | Reliance Industries | 21.89 | 95 |
| 14 | TOTAL b | 21.62 | 605 |
| 15 | Nutrien | 19.64 | 4 |
| 16 | ChemChina a | 18.73 | 776 |
| 17 | Toray Industries 1 | 18.46 | 1664 |
| 18 | Sherwin-Williams | 17.53 | 74 |
| 19 | Evonik | 16.90 | 1361 |
| 20 | Covestro | 16.44 | 776 |
| 21 | Bayer | 16.05 | 2130 |
| 22 | Sumitomo Chemical 1 | 15.91 | 1606 |
| 23 | PPG Industries | 15.40 | 391 |
| 24 | Linde plc | 14.90 | 299 |
| 25 | Ecolab | 14.67 | 741 |
| 26 | Braskem | 14.36 | 49 |
| 27 | Shin-Etsu Chemical 1 | 14.29 | 1294 |
| 28 | Lotte Chemical | 13.90 | 232 |
| 29 | AGC | 13.65 | 837 |
| 30 | Mitsui Chemicals 1 | 13.29 | 541 |
| 31 | Johnson Matthey c | 13.26 | 593 |
| 32 | Yara International | 12.90 | 57 |
| 33 | Solvay | 11.54 | 487 |
| 34 | Chevron Phillips Chemical | 11.31 | 183 |
| 35 | Indorama Ventures | 10.89 | 0 |
| 36 | Henkel Adhesive Technologies | 10.58 | 1161 |
| 37 | Asahi Kasei 1 | 10.54 | 551 |
| 38 | DSM | 10.42 | 657 |
| 39 | AkzoNobel | 10.41 | 364 |
| 40 | Sekisui Chemical 1 | 10.24 | 611 |
| 41 | Eastman Chemical | 10.20 | 178 |
| 42 | Arkema | 9.92 | 993 |
| 43 | Mosaic | 9.60 | 19 |
| 44 | Huntsman | 9.38 | 184 |
| 45 | Borealis | 9.38 | 483 |
| 46 | PTT Global Chemical | 9.09 | 22 |
| 47 | Wanhua Chemical | 9.03 | 256 |
| 48 | SK Innovation d | 8.97 | 125 |
| 49 | Air Products | 8.93 | 139 |
| 50 | Westlake | 8.64 | 8 |
| 51 | LANXESS | 8.16 | 205 |
| 52 | Teijin 1 | 7.96 | 218 |
| 53 | Tosoh 1 | 7.80 | 122 |
| 54 | Umicore c | 7.72 | 221 |
| 55 | Sasol 2 | 7.45 | 78 |
| 56 | DIC | 7.32 | 1179 |
| 57 | Celanese | 7.16 | 86 |
| 58 | Alpek (Grupo Alfa) | 6.99 | no figures |
| 59 | SCG Chemicals | 6.95 | 61 |
| 60 | Lubrizol | 6.80 | 346 |
| 61 | Chemours | 6.64 | 136 |
| 62 | Clariant | 6.52 | 342 |
| 63 | Hanwha Chemical | 6.21 | 71 |
| 64 | Mitsubishi Gas Chemical 1 | 5.82 | 674 |
| 65 | Versalis | 5.76 | 85 |
| 66 | GS Caltex d | 5.70 | 25 |
| 67 | Honeywell | 5.69 | 748 |
| 68 | Kaneka 1 | 5.61 | 423 |
| 69 | ICL | 5.57 | 15 |
| 70 | Lonza | 5.45 | 101 |
| 71 | Givaudan | 5.44 | 99 |
| 72 | Wacker-Chemie | 5.41 | 309 |
| 73 | Kuraray | 5.40 | 554 |
| 74 | RPM International 4 | 5.56 | no figures |
| 75 | Idemitsu 1 | 4.98 | 509 |
| 76 | FMC | 4.73 | 134 |
| 77 | Petronas Chemicals Group | 4.68 | 23 |
| 78 | Occidental Petroleum | 4.66 | 6 |
| 79 | Trinseo | 4.62 | 31 |
| 80 | Sojitz 1 | 4.62 | 1 |
| 81 | K+S | 4.54 | 3 |
| 82 | NOVA Chemicals | 4.47 | 101 |
| 83 | CF Industries | 4.43 | 0 |
| 84 | SIBUR | 4.21 | 30 |
| 85 | JSR 1 | 4.02 | 225 |
| 86 | IFF | 3.98 | 60 |
| 87 | Incitec Pivot 3 | 3.86 | 0 |
| 88 | Orica 3 | 3.83 | 10 |
| 89 | Showa Denko | 3.81 | 340 |
| 90 | Hexion | 3.80 | 36 |
| 91 | Ashland 3 | 3.74 | 22 |
| 92 | Denka 1 | 3.70 | 247 |
| 93 | Symrise | 3.55 | 66 |
| 94 | PolyOne | 3.53 | 49 |
| 95 | Methanex | 3.39 | 1 |
| 96 | Albemarle | 3.37 | 73 |
| 97 | Cabot | 3.24 | 133 |
| 98 | Nippon Shokubai 1 | 3.13 | 138 |
| 99 | Daicel Corp 1 | 3.12 | 225 |
| 100 | Mexichem | 3.12 | 42 |
Table 1: Top 100 List
a) Chemical sales and No. of patents are the sum of several subsidiaries. Subsidiaries taken into account in this report are
(1) INEOS: INEOS Group, Styrolution and INOVYN
(2) Formosa Plastics: Formosa Chemicals & Fibre, Formosa Petrochemical and Formosa Plastics Corporation
(3) ChemChina: Syngenta, Adisseo, Shenyang Chemical, Haohua Chemical, Hechi Chemical, Cangzhou Dahua, ADAMA
b) Daydream’s estimation
c) Chemical sales include a significant amount of nonchemical products
d) Only counts the No. of employee working in the country of headquarter
- Fiscal year ended 31 March 2019
- Fiscal year ended 30 June 2018
- Fiscal year ended 30 September 2018
- Fiscal year ended 31 May 2019
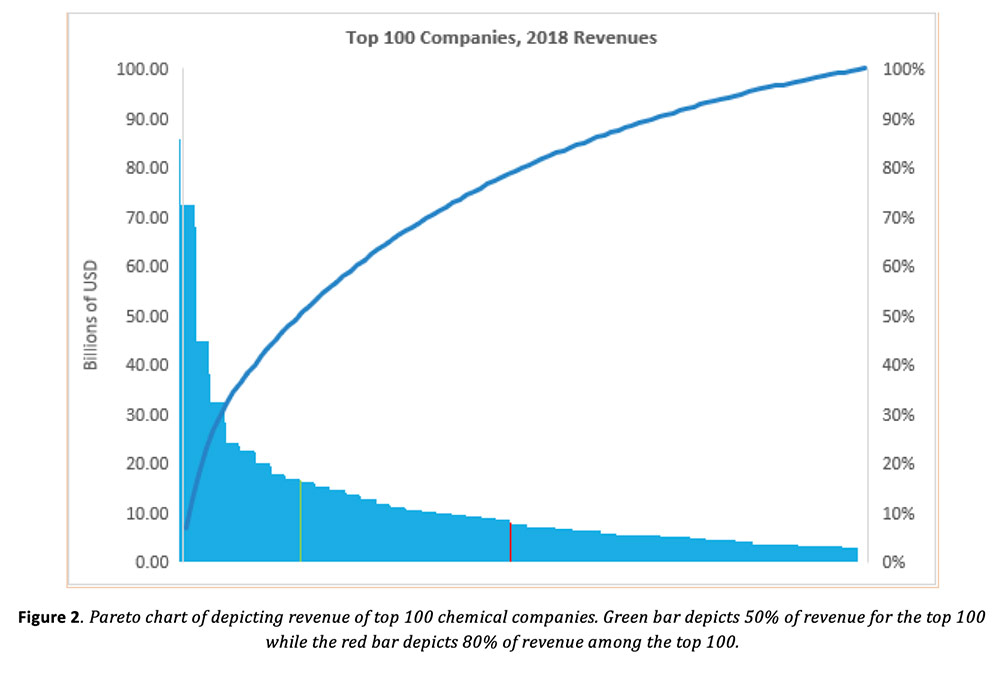
A Pareto chart in Figure 2 depicts the 2018 revenues of the top 100 companies. The top 20 in our list account for more than half the total revenue of the top 100 list. In fact, the top 19 make up 50% of the revenue (see below: 19th company marked with green line). About 80% of the revenue is accounted for by the 50th company in the list (see below: marked in red). Thus, it can be concluded that there are a few large players that represent a significant portion of the market, such as BASF or LyondellBasell Industries. However, some moderation is expected going forward now that DowDuPont has completed its fragmentation into three companies in the first half of 2019: Dow, DuPont, and Corteva Agroscience.
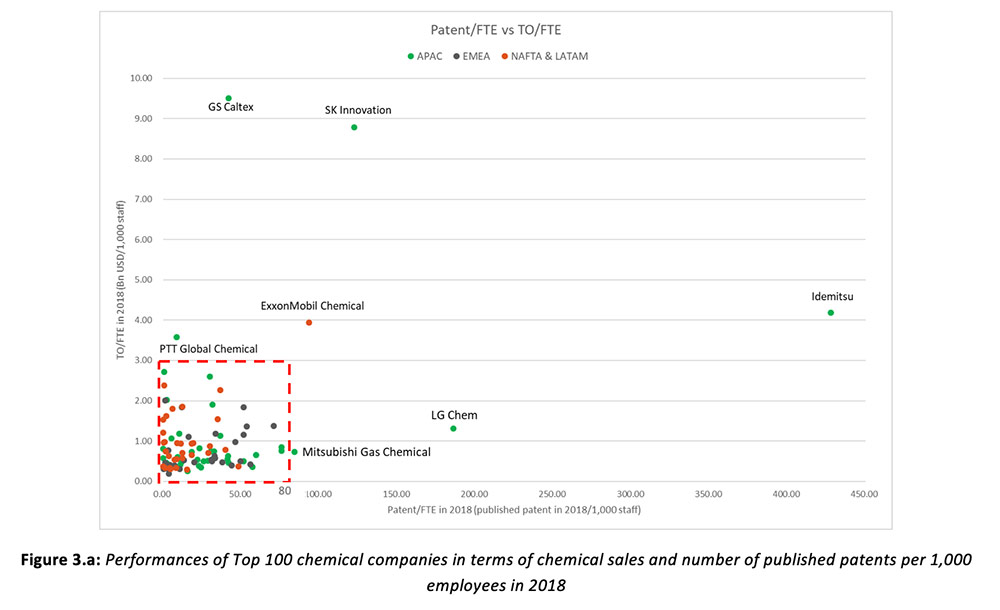
How are patent activity and revenue correlated?
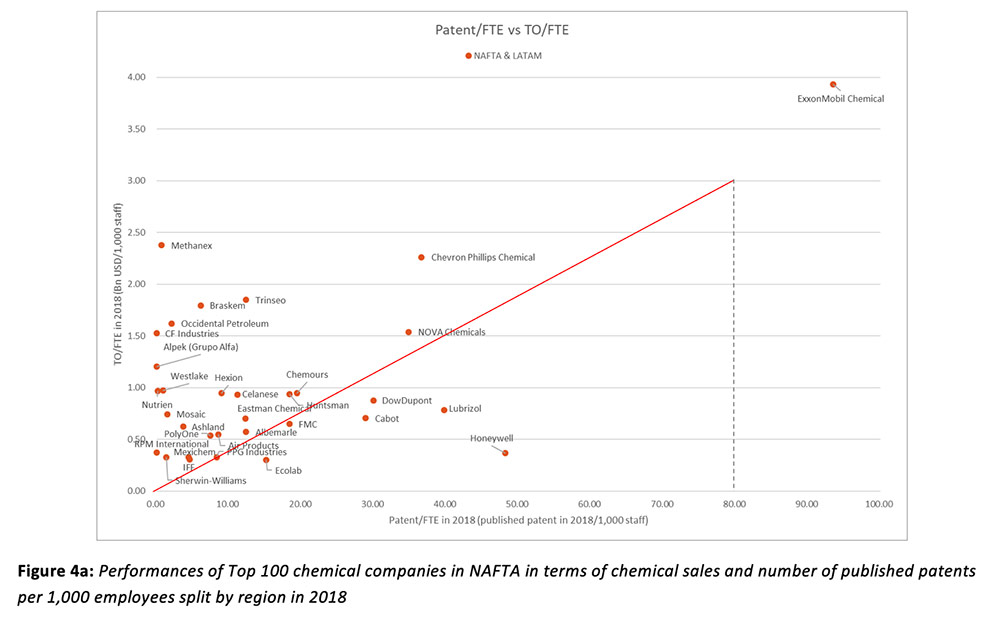
As shown in the figures (Figure 3a), more than 90% of the companies fall in area with X-axis (patent/FTE) values of <3 and Y-axis (TO/FTE) values of <80. In order to display the data points more clearly, Figure 3.b displays more clearly this cluster of data points. In this detailed view, company names and regions are labeled.
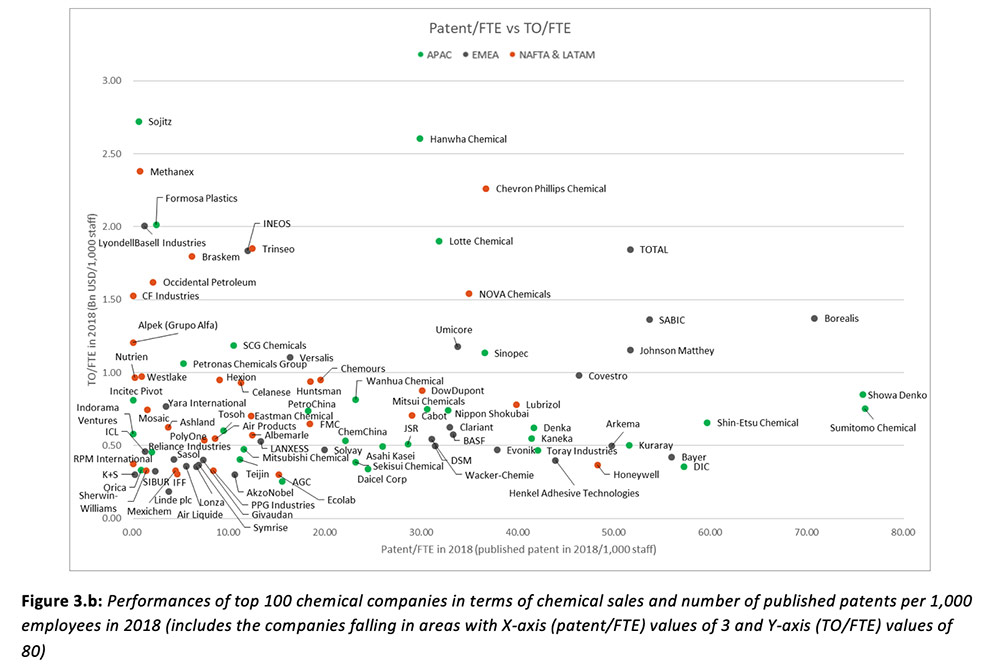
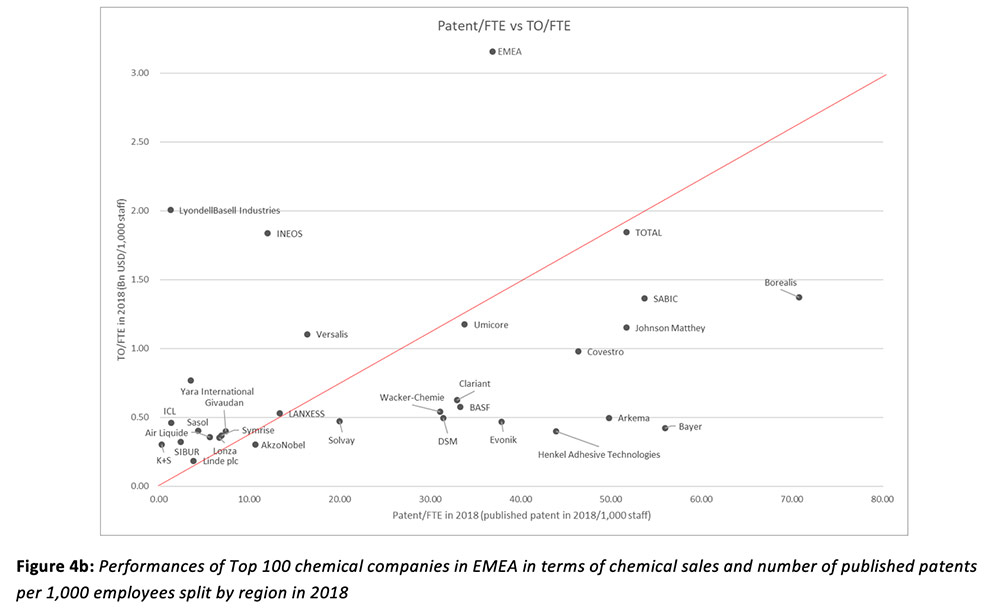
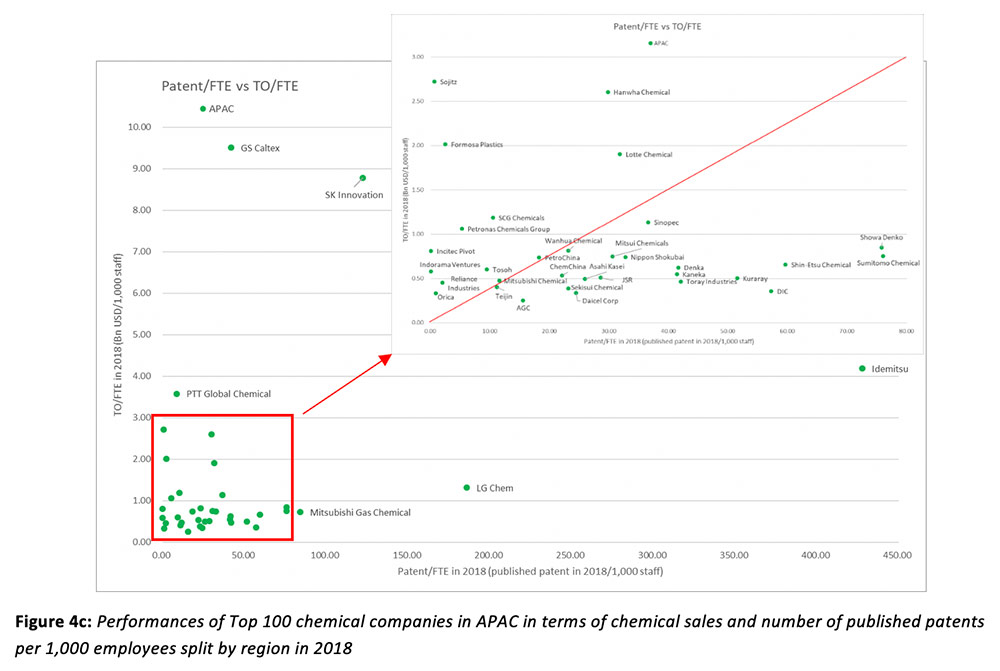
If we add an auxiliary line and exclude excessive data on both axes, we can associate companies place above the line with a higher revenue (turnover) focus and those below the line with a higher innovation focus. Thus, one can see in Figure 4a-c that performance of companies in NAFTA is more inclined to turnover rather than patents, while EMEA’s is inclined toward R&D investment. APAC companies seem to find a balance between these two extremes.
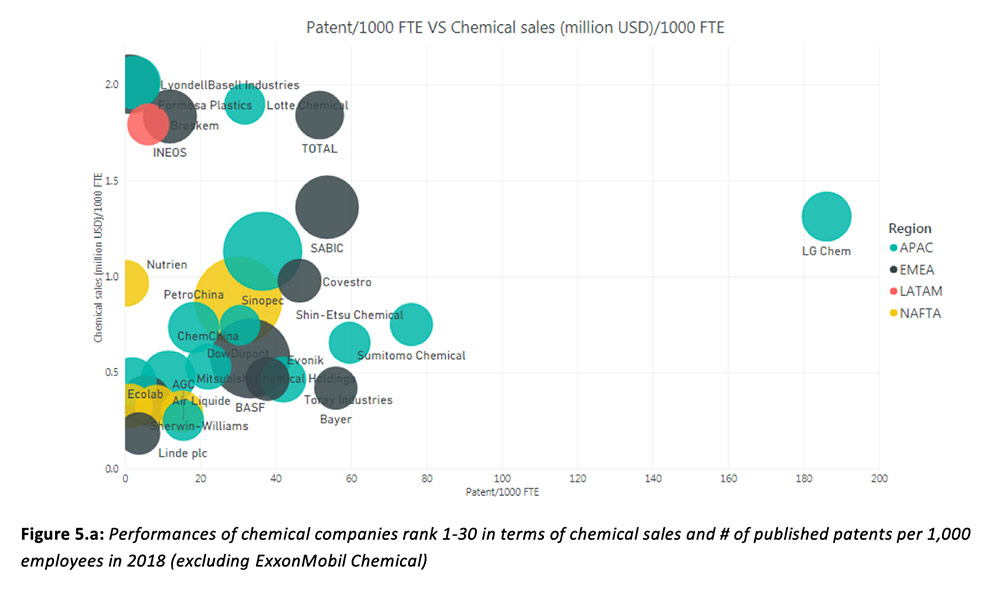
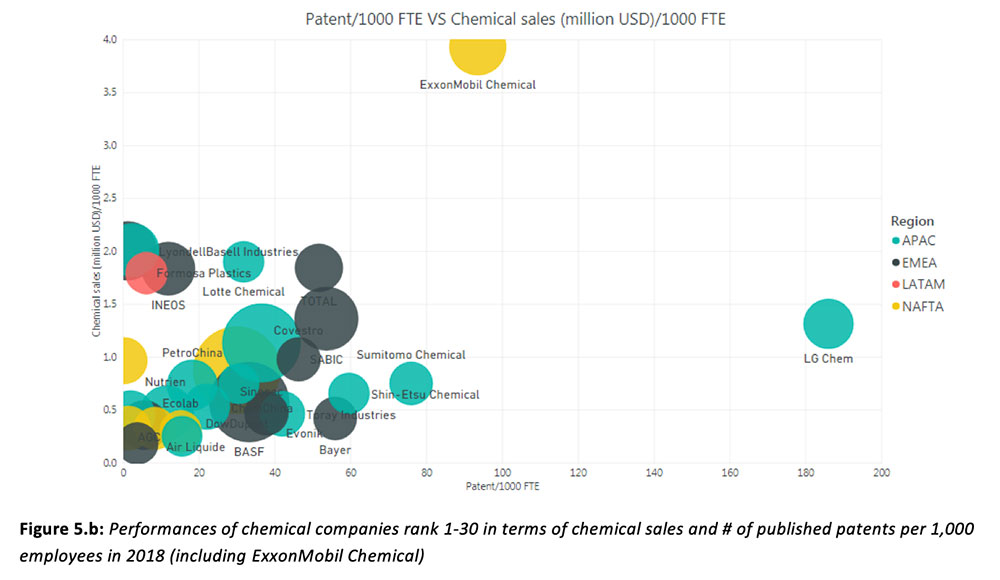
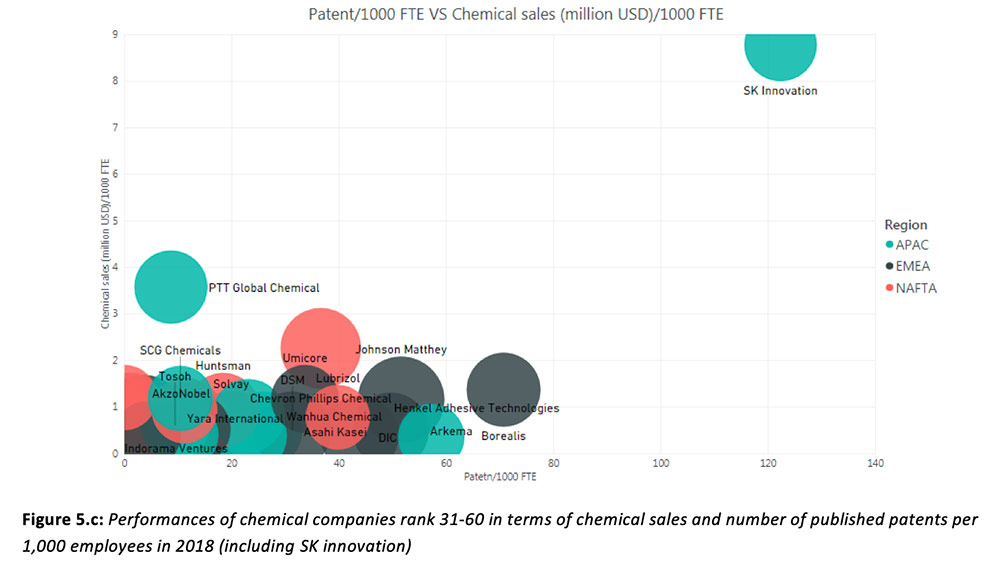
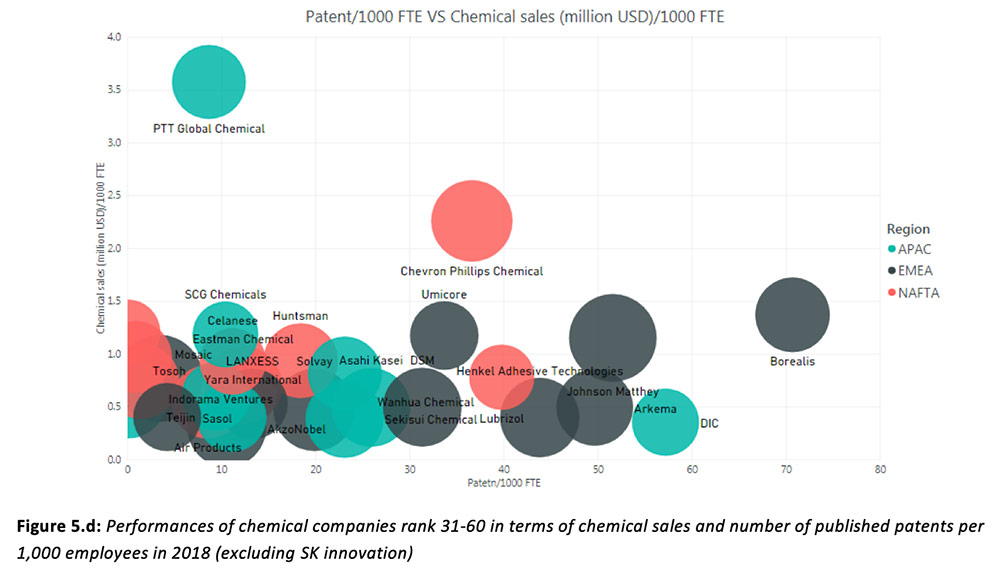
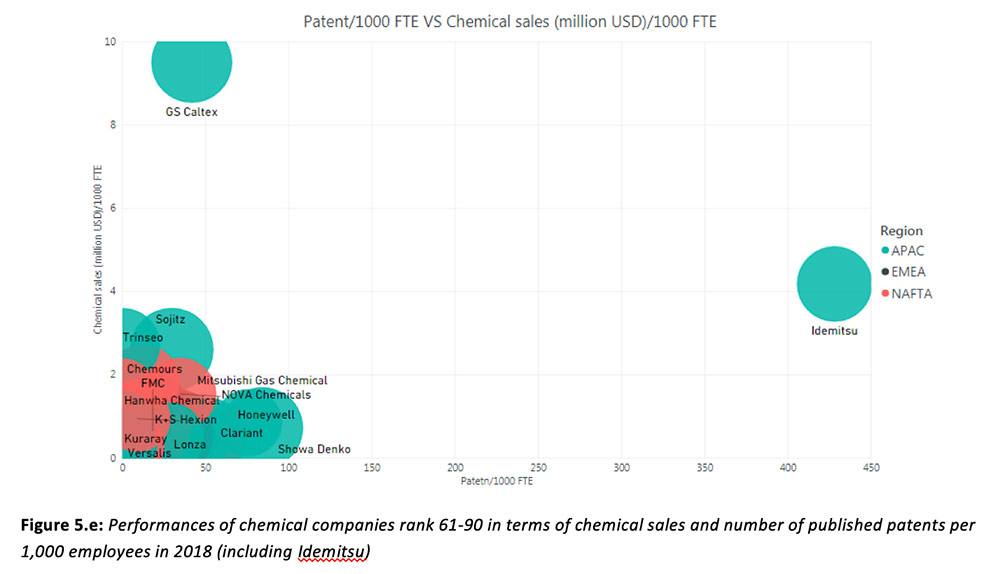
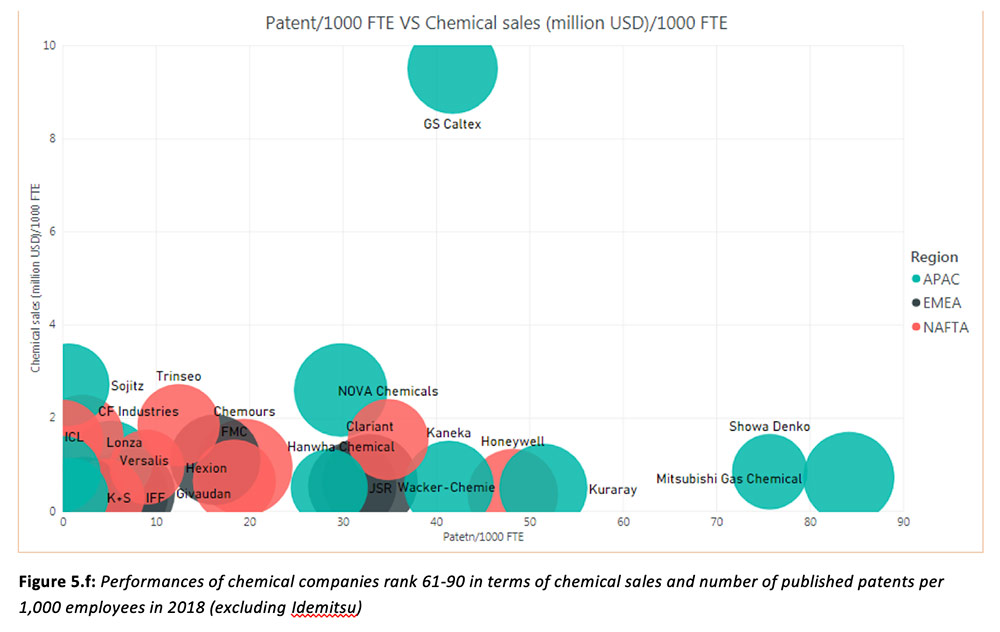
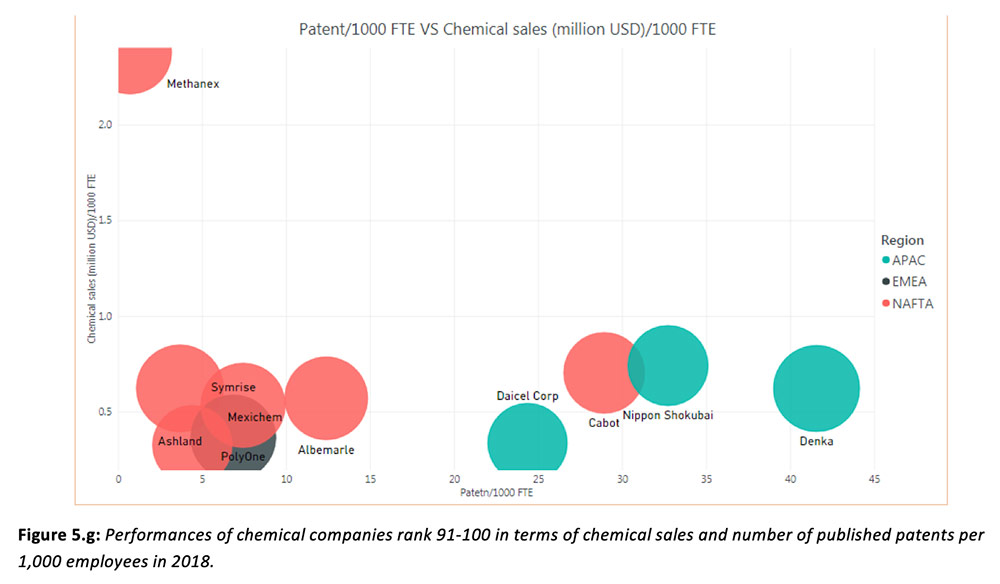
The following figures (Figure 5a-d) showcase the relationship between a company’s chemical sales and its patent output per 1000 employees.
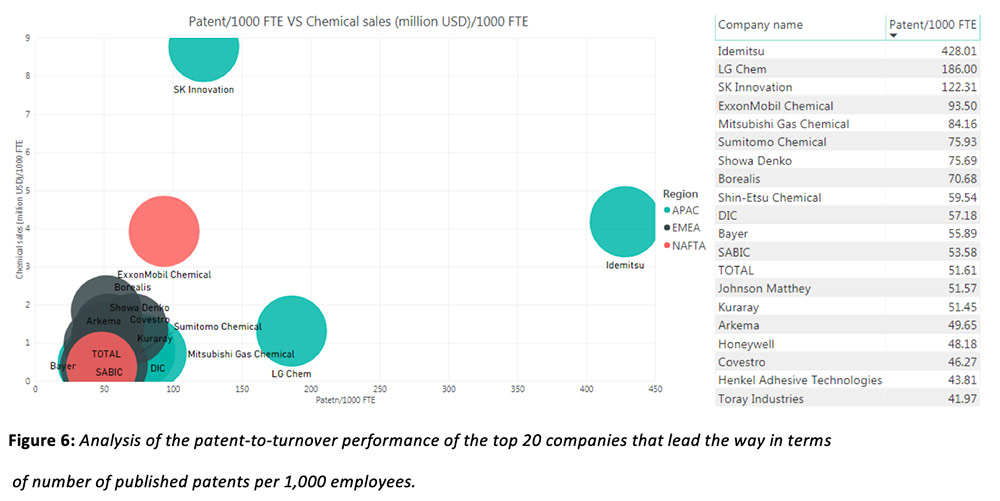
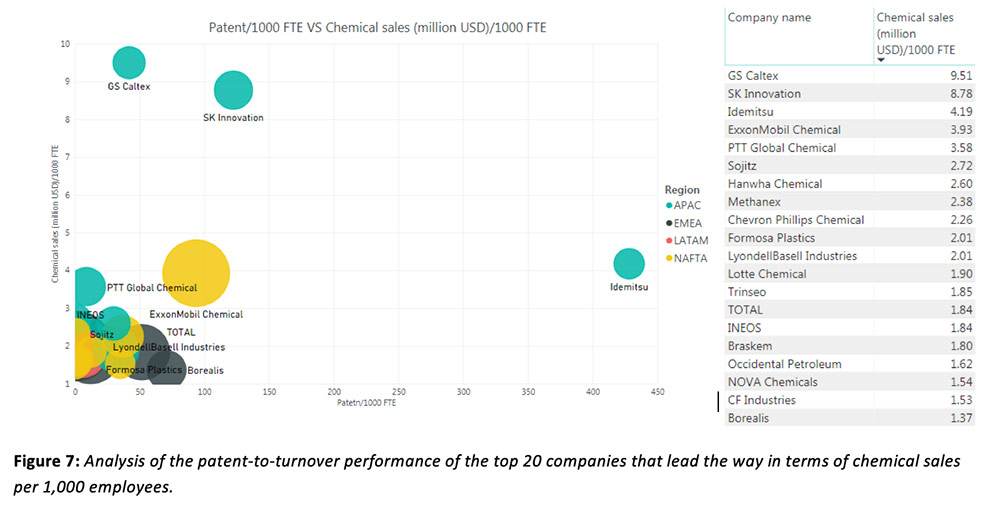
Below, Figure 6 highlights the top 20 companies by number of published patents per 1,000 employees, while Figure 7 focuses on the top 10 companies by chemical sales per 1,000 employees.
How does R&D expenditure correlate with revenue?
Using 2017 and 2018 research and development (R&D) expense reported in annual reports when available, Daydream analyzed the year-over-year growth and compared it to company revenues. Figure 8 depicts revenue growth versus R&D expense growth at each of the top 100 where data was available.
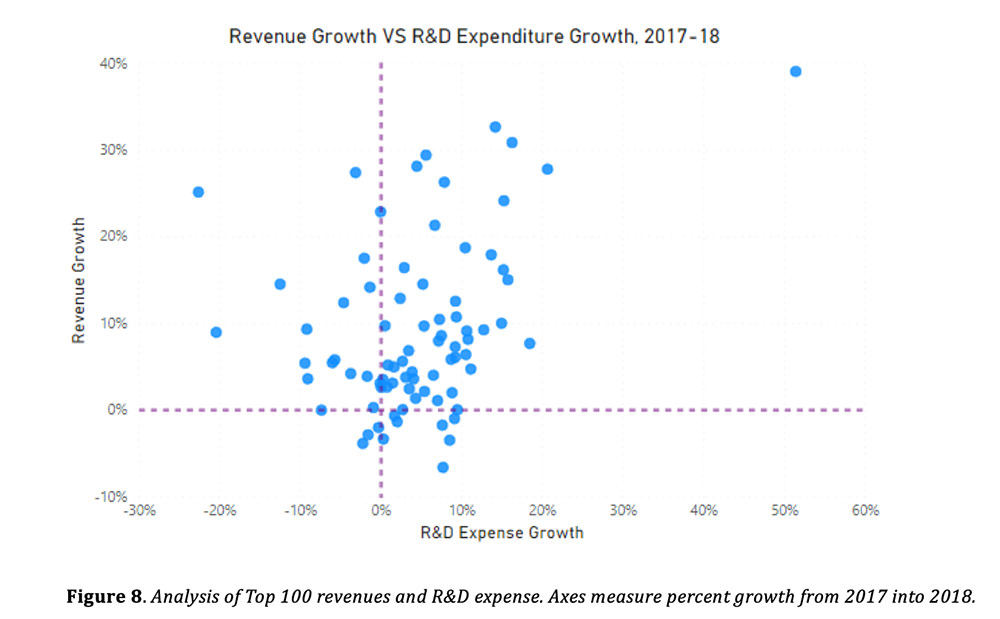
The conclusions that can be drawn from the data in Figure 8 are limited, however, trends arise when breaking down the data by region. Figure 9a-c show the same data but broken down into 3 regions: APAC, EMEA, and NAFTA.
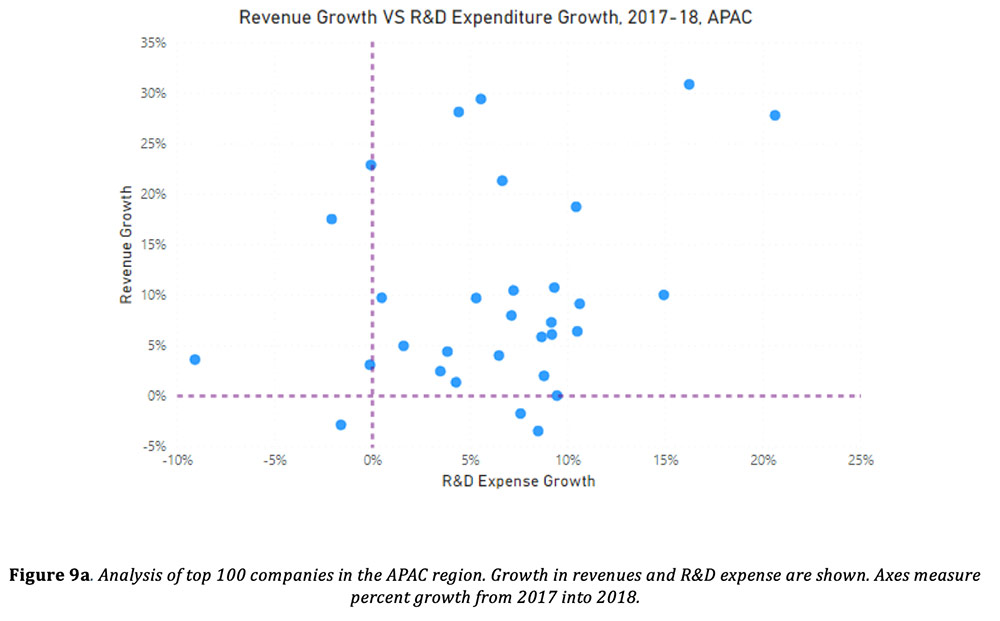
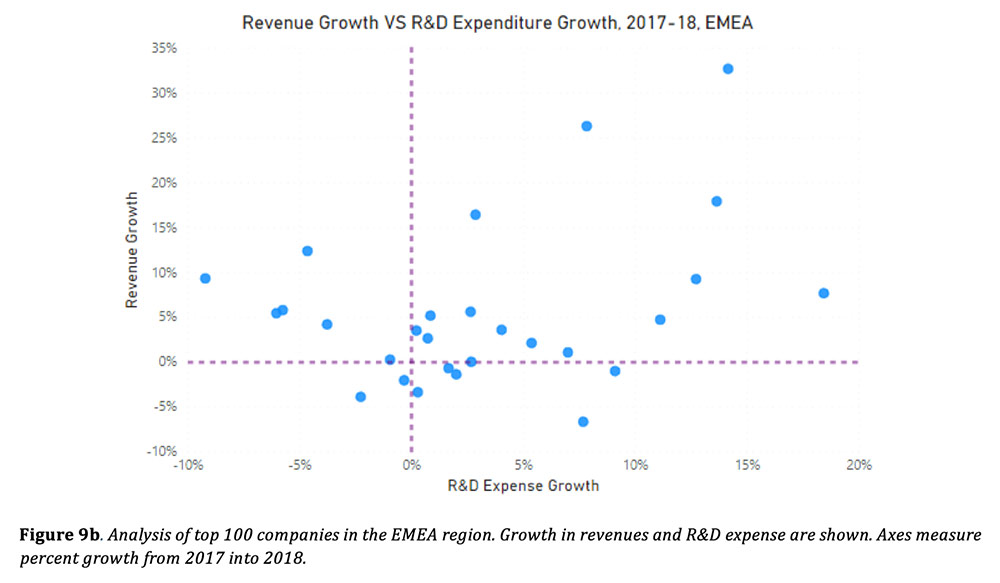
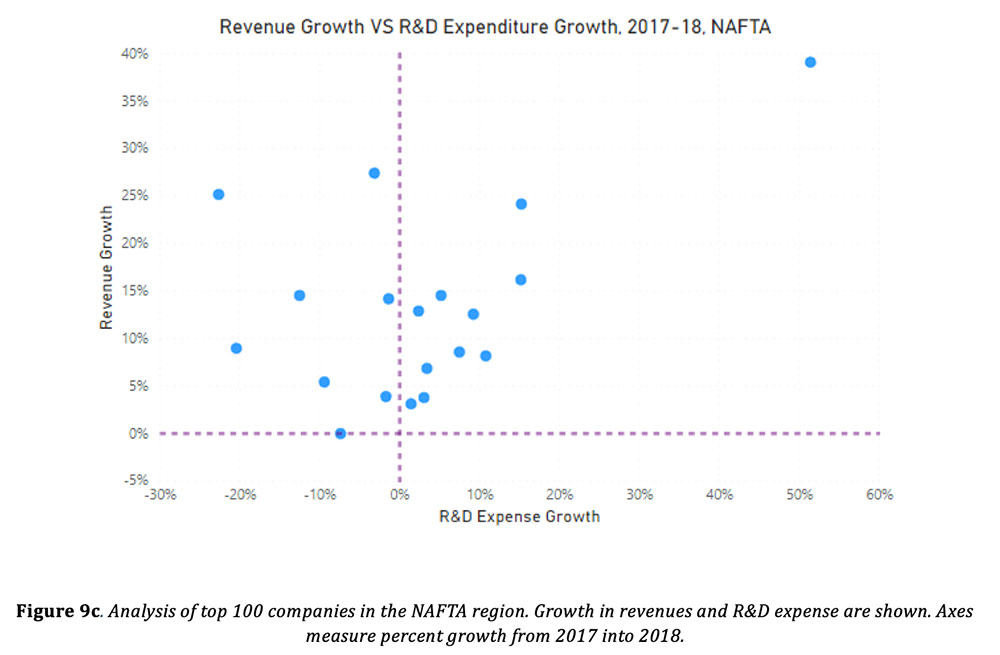
In the EMEA and APAC regions (Figure 9a + 9b), one can see a correlation that higher revenue growth occurs when more is invested in R&D. There is a general absence of strong revenue performance when R&D growth is negative. However, this is not the case with the NAFTA region. Here, it is apparent that revenue growth is achieved by companies with both negative and positive growth in R&D expenditure. This suggests that NAFTA-based companies emphasize efficiency over innovation and is consistent with what was discussed above in Figure 4 where it was noted that NAFTA-based companies focused on revenue over patents and innovation.
Conclusion
While North America, Europe, and Asia share almost even distribution of Top 100 chemical companies, they have a slightly different focus when it comes to investing in product development. NAFTA is more predicated on efficiency and revenue while EMEA companies have a stronger focus on innovation, as demonstrated by their patent output and R&D investment. APAC companies tend to bridge the gap and balance both of these strategies.
And since 2000, Daydream-Dynovel has a history of working with many of the familiar names on this top 100 list. To learn more about how Daydream-Dynovel can help you on your Grow Strategy, please contact us: contact@daydream.eu, contact@dynovel.com or directly jean-louis.cougoul@daydream.eu


