


Introduction
In the current context we have decided to deepen our knowledge of chemical companies and share it with you. We did not limit our investigation only to the top-100 but targeted 300 companies (among 400 identified companies). This resulted in a thorough study that we are introducing hereafter in this D-News. If you are interested in getting more information and the full analysis you can purchase the exhaustive study namely the Market Report in PDF format (option 1). You can also choose to add the Data Excel file (option 2) and complete option 2 with the Complete Book of the Data Sources (option 3).
You will find all the commercial options we propose around this topic at the bottom of this D-News after the article.
Our study is based on 2018 chemical sales rankings and major financial data (but not only) for 2019 disclosed by various chemical companies. We, Daydream & Dynovel selected the top 300 chemical companies according to chemical sales revenue in 2019. For most companies, the latest data came from calendar year 2019, while the remaining companies reported different 12-month periods.
In the report we evaluated the efficiency and innovativeness of the Top 300 chemical companies by using such unconventional parameters as Turnover / Employees (for the efficiency), Patents / employees and R&D Expenditures / Employees. For the Top 50 companies, we additionally studied the evolution of the performance from 2018 to 2019. One of the goals of the report was to identify the key success factors for the chemical companies.
Furthermore, we analyzed the geographical foot print and diversification of the manufacturing systems to estimate how well the companies are positioned to mitigate the risks in case of crisis in particular countries and / or regions. In the context of the current COVID-19 pandemic situation it becomes even more important for the chemical companies to optimize production systems to be able to overcome such unexpected regional or global crises.
In addition to the Top 300 chemical companies included in the final ranking, we provided the list of further 100 companies which were investigated, but not enclosed in the list Top 300 chemical companies, as the information identified for those companies was not complete for the analysis.
Based on the data collected we developed while remaining within the standards of the D-Method the final ranking for the Top 100 chemical companies which is oriented towards the future and helps evaluate which companies are going to be the most efficient in the financial terms and which innovation potential they are going to have in the nearest future.
The current report not only compares the chemical companies by their financial performance, but more importantly it provides a better understanding of the future of the chemical companies based on their efficiency and capacity to innovate.
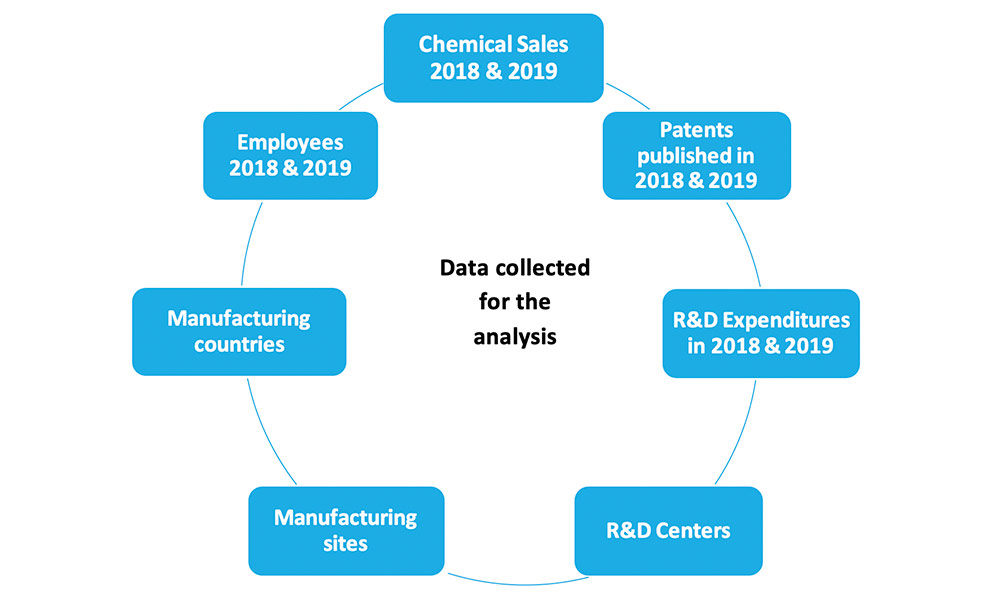
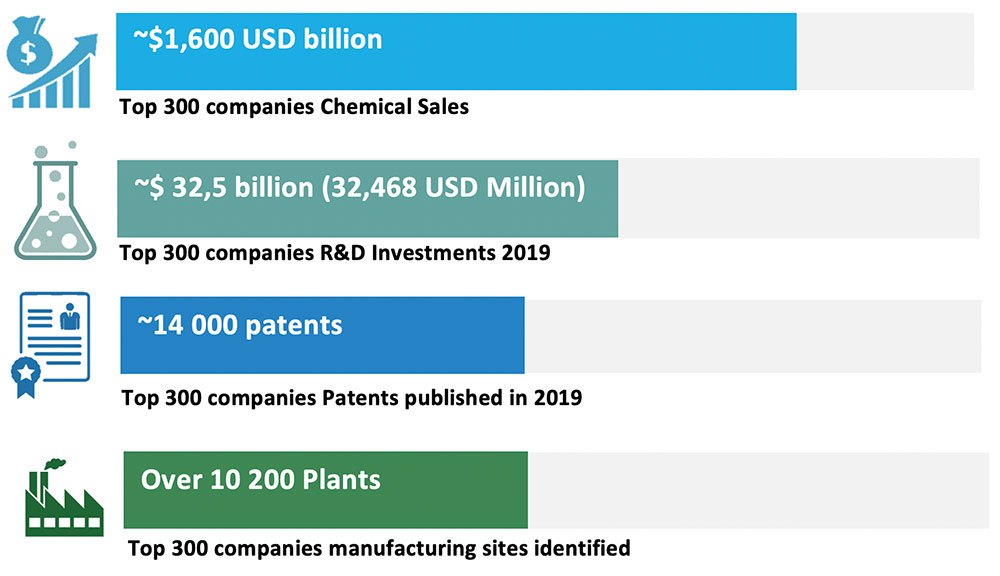
Key figures in 2019:
Overview of the Global Top 300 Chemical Companies
According to our analysis of the Top 300 chemical company list, the regional distribution worldwide is fairly even. EMEA (Europe, Middle East & Africa) leads the way, with 108 of the top 300 headquartered there, followed by APAC (Asia-Pacific) with 101 companies and NA & LATAM (North America & Latin America) with the remaining 91. Together, the top 300 revenues account for a total of $1,594 billion (1,594,267 USD Million) in chemical sales in 2019. The regional and country distribution of the companies is depicted in Figure 1
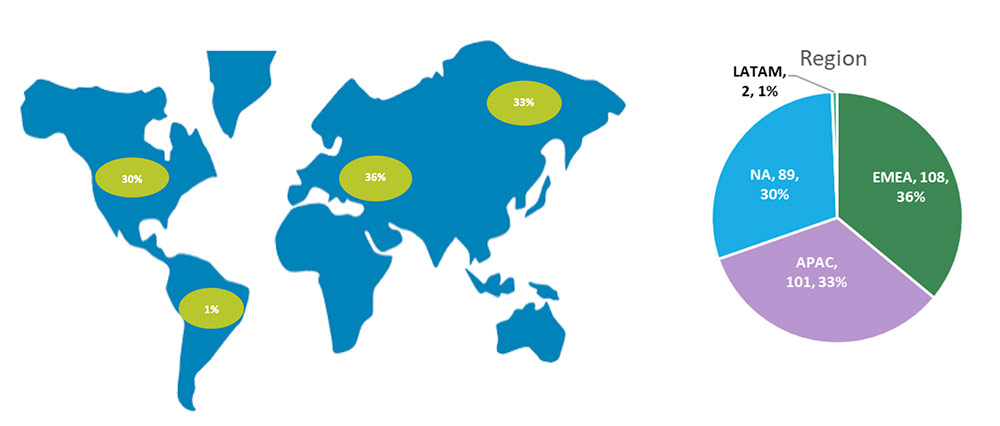
Roughly even distribution of the Top 300 Chemical Companies across 3 regions: EMEA; NA&LATAM; APAC
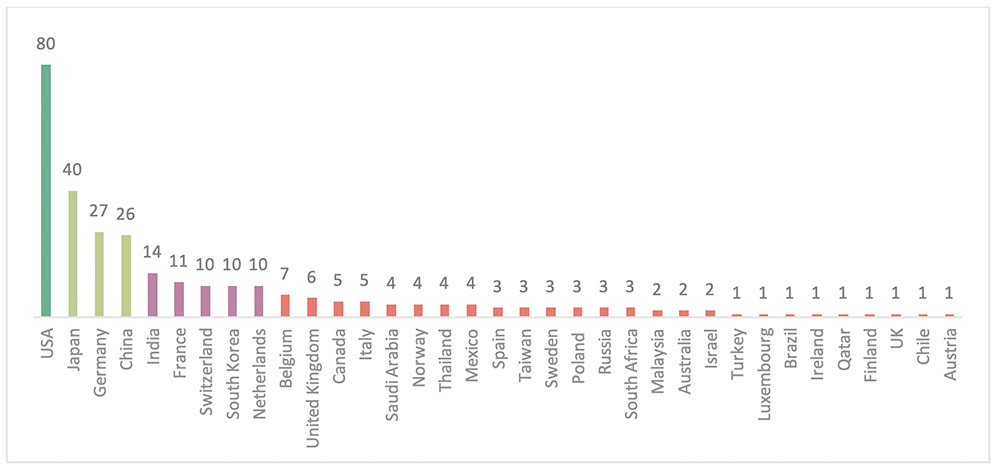
Figure 1: Top 300 chemical companies split by region (top) and by country (bottom (2019)
The following table (Table.1) shows the Top 300 list
| Rank | Company Name |
| 1 | BASF |
| 2 | Sinopec |
| 3 | Dow |
| 4 | Sabic |
| 5 | LyondellBasell Industries |
| 6 | Linde Plc |
| 7 | Mitsubishi Chemical Holding |
| 8 | ExxonMobil Chemical |
| 9 | Air Liquide |
| 10 | Chemchina |
| 11 | LG Chem |
| 12 | Petrochina |
| 13 | Bayer Crop Science |
| 14 | Dupont |
| 15 | Sumitomo Chemical |
| 16 | Reliance Chemicals |
| 17 | Sherwin-Williams |
| 18 | Toray Industries |
| 19 | Total (Chemical Part) |
| 20 | Shell Chemicals |
| 21 | PPG |
| 22 | Ineos |
| 23 | Shin-Etsu Chemical |
| 24 | Evonik |
| 25 | Brenntag |
| 26 | Corteva Agriscience |
| 27 | Syngenta |
| 28 | Covestro |
| 29 | Yara International |
| 30 | Mitsui Chemicals |
| 31 | Solvay |
| 32 | Lotte Chemical |
| 33 | Indorama Ventures |
| 34 | Chevron |
| 35 | Formosa Chemicals & Fibre |
| 36 | Sekisui Chemical |
| 37 | SC Johnson |
| 38 | Henkel Adhesive Technologies |
| 39 | Asahi Kasei |
| 40 | SK Innovation |
| 41 | AkzoNobel |
| 42 | Nutrien |
| 43 | DSM |
| 44 | Wanhua Chemical |
| 45 | Arkema |
| 46 | Braskem |
| 47 | Chevron Phillips Chemical |
| 48 | Univar |
| 49 | Eastman Chemical |
| 50 | Air Products |
| 51 | Mosaic |
| 52 | Borealis |
| 53 | Sika |
| 54 | Saint Gobain |
| 55 | Idemitsu |
| 56 | Westlake Chemical |
| 57 | Taiyo Nippon Sanso |
| 58 | Hanwha Chemical |
| 59 | Tosoh |
| 60 | Nagase Chemtex |
| 61 | PTT Global Chemical |
| 62 | Lanxess |
| 63 | DIC |
| 64 | RongSheng Petrochemical |
| 65 | Formosa Plastics Corporation |
| 66 | Orbia / Mexichem |
| 67 | Nitto Denko |
| 68 | Huntsman |
| 69 | Clariant |
| 70 | Sasol |
| 71 | Lubrizol |
| 72 | Nippon Paint |
| 73 | Givaudan |
| 74 | Celanese |
| 75 | Alpek (Grupo Alfa) |
| 76 | EuroChem |
| 77 | Olin |
| 78 | Avantor Performance Materials |
| 79 | Teijin |
| 80 | Formosa Petrochemical |
| 81 | SCG Chemicals |
| 82 | Kaneka |
| 83 | RPM International |
| 84 | Nouryon Group |
| 85 | Chemours |
| 86 | Helm AG |
| 87 | Mitsubishi Gas Chemical |
| 88 | Styrolution (part of Ineos) |
| 89 | Wacker-Chemie |
| 90 | Kuraray |
| 91 | ICL Group |
| 92 | Johnson Matthey |
| 93 | IFF (International Flavors & Fragrances) |
| 94 | Honeywell |
| 95 | Imerys |
| 96 | Hutchinson |
| 97 | Gs Caltex |
| 98 | FMC |
| 99 | CF Industries |
| 100 | Versalis |
| 101 | Axalta |
| 102 | JSR Corporation |
| 103 | K+S |
| 104 | AGC Chemicals |
| 105 | United Phosphorous Ltd |
| 106 | Occidental Chemical |
| 107 | Kingfa |
| 108 | Orica |
| 109 | Firmenich |
| 110 | Adama Agricultural Solutions |
| 111 | Kansai Paint |
| 112 | Roquette |
| 113 | Trinseo |
| 114 | Petronas Chemicals Group |
| 115 | Nufarm |
| 116 | Ecolab b |
| 117 | Symrise AG |
| 118 | Umicore |
| 119 | SNF Floerger |
| 120 | Showa Denko |
| 121 | Sibur |
| 122 | Sibelco |
| 123 | Albemarle |
| 124 | Nova Chemicals |
| 125 | Denka 1 |
| 126 | Calumet Specialty Products |
| 127 | Hexion |
| 128 | Tate & Lyle |
| 129 | Cabot |
| 130 | Methanex |
| 131 | Arlanxeo |
| 132 | Sojitz |
| 133 | Daicel Corp |
| 134 | Mapei |
| 135 | OCI Nitrogen |
| 136 | Solenis |
| 137 | PKN Orlen |
| 138 | IMCD |
| 139 | Sinochem Group |
| 140 | Kemira |
| 141 | Yuntianhua |
| 142 | Polyone (now Avient) |
| 143 | Aarhus Karlshamn |
| 144 | Nippon Shokubai |
| 145 | Merck KGaA |
| 146 | Fuchs Petrolub |
| 147 | 3M |
| 148 | Masco |
| 149 | Grupa Azoty |
| 150 | Incitec Pivot |
| 151 | UBE |
| 152 | Kao Chemicals |
| 153 | Tronox |
| 154 | CEPSA |
| 155 | Saudi Kayan |
| 156 | Nizhnekamskneftekhim |
| 157 | Ashland |
| 158 | Altana |
| 159 | Fujifilm Holdings Corporation |
| 160 | Zhejiang Longsheng Group (Lonsen) |
| 161 | Allnex |
| 162 | Carpenter Technology |
| 163 | Hexcel |
| 164 | Hitachi Chemical |
| 165 | Asian Paints Ltd |
| 166 | Polynt- Reichhold |
| 167 | EMS-Chemie |
| 168 | Aditya-Birla-Grasim |
| 169 | Rabigh Refining and Petrochemical |
| 170 | J.M. Huber Corporation / CP Kelco |
| 171 | Heraeus |
| 172 | Newmarket Corp. |
| 173 | Flint Group |
| 174 | Venator |
| 175 | Owens Corning |
| 176 | OCI Company |
| 177 | Adeka |
| 178 | Jotun |
| 179 | Nissan Chemical |
| 180 | W.R. Grace |
| 181 | KLK (Oleochemicals Part) |
| 182 | SQM |
| 183 | Irpc Public Company Limited |
| 184 | Longji Green Energy Technology |
| 185 | Stepan |
| 186 | Tessenderlo Group |
| 187 | Röhm |
| 188 | Element Solutions Inc |
| 189 | Kraton |
| 190 | Synthomer |
| 191 | Rayonier Advanced Materials |
| 192 | Koppers |
| 193 | Petkim Petrokimya |
| 194 | Lonza |
| 195 | Kronos Worldwide |
| 196 | Nynas |
| 197 | NOF Corporation |
| 198 | Croda Group |
| 199 | ITW (Polymers & Fluids division) |
| 200 | Zhejiang Juhua |
| 201 | KPIC (Korea Petrochemical) |
| 202 | PQ Corporation |
| 203 | Adisseo |
| 204 | Hexpol |
| 205 | H.B. Fuller |
| 206 | Zheijang Wynca Chemical |
| 207 | Innospec |
| 208 | Beiersdorf (Tesa Adhesives Part) |
| 209 | Compass Minerals |
| 210 | Americas Styrenics |
| 211 | Orion |
| 212 | Shandong Dongyue Chemical |
| 213 | Takasago International Corporation 1 |
| 214 | Minerals Technologies |
| 215 | Tata chemicals |
| 216 | Xingfa |
| 217 | Sensient Technologies Corporation |
| 218 | Zibo Qixiang Tengda Chemical |
| 219 | Barentz International |
| 220 | OQ Chemicals (Oxea) |
| 221 | AdvanSix |
| 222 | Ingevity |
| 223 | Maxam |
| 224 | Freudenberg (Chemical Part) |
| 225 | Messer Group |
| 226 | Nippon Soda (“Nisso”) |
| 227 | Radici Group |
| 228 | Industries Qatar |
| 229 | H&R Group |
| 230 | Perstorp |
| 231 | Quaker Houghton |
| 232 | Genesis Energy |
| 233 | Albis |
| 234 | Omnia Holdings |
| 235 | Corbion |
| 236 | Cabot Microelectronics |
| 237 | Jiangsu Yangnong Chemical |
| 238 | SWM |
| 239 | Ferro Corporation |
| 240 | GCP Applied Technologies |
| 241 | Zhejiang Nhu |
| 242 | Domo Chemicals |
| 243 | Kukdo |
| 244 | Hangzhou First Applied Material |
| 245 | Kelly-Moore Paint CO. Inc |
| 246 | Kumiai Chemical |
| 247 | Elementis |
| 248 | Huber Group |
| 249 | BEFAR |
| 250 | Siegfried |
| 251 | Ciech Group |
| 252 | TOKEN |
| 253 | PCC Group |
| 254 | Prayon |
| 255 | Zhejiang Zanyu Technology Co |
| 256 | BERGER PAINTS INDIA |
| 257 | India Glycols Ltd. |
| 258 | Innophos |
| 259 | Nippon Kayaku |
| 260 | Nutrichem |
| 261 | Omnova |
| 262 | KANSAI NEROLAC PAINTS LTD. |
| 263 | Lhoist Group |
| 264 | Ercros |
| 265 | Arakawa |
| 266 | Zschimmer & Schwarz |
| 267 | Songwon |
| 268 | Balchem |
| 269 | Kureha |
| 270 | Italmatch |
| 271 | Robertet Group |
| 272 | Huabao International |
| 273 | Gurit |
| 274 | Kuo (Dynasol & Resinere) |
| 275 | Borregaard |
| 276 | Atul Ltd. |
| 277 | Cerdia |
| 278 | Tasnee |
| 279 | Aarti Industries Ltd. |
| 280 | Hansol Chemical |
| 281 | Lianhetech |
| 282 | T. Hasegawa |
| 283 | AMVAC |
| 284 | Rain Carbon |
| 285 | Vencorex |
| 286 | Goodyear Tire & Rubber |
| 287 | Livent |
| 288 | Guangzhou Tinci |
| 289 | Gujarat Alkalies & Chemicals |
| 290 | Idesa |
| 291 | Victrex |
| 292 | EOC Group |
| 293 | Gujarat Fluoro Chemicals |
| 294 | VALIANT |
| 295 | Aeci |
| 296 | Shawcor Ltd. |
| 297 | GHCL Ltd. |
| 298 | Peroxychem |
| 299 | Stahl |
| 300 | Cloverdale Paint Inc. |
Table 1: Top 300 List 2019
The final ranking of the Top 100 companies is based on the efficiency, as well as the ability of the companies to innovate today and in the near future. We applied the following parameters in order to form the ranking for the Top 100 companies:
- Rank Turnover/1000 Employees: to evaluate the efficiency of the company today
- Rank Patents/ 1000 Employees: to evaluate the innovation efficiency of the company today
- Rank R&D Expenditures. / 1000 Employees: to evaluate the innovation potential for the future
In the table below we have presented the Top 10 companies from the final ranking, for the complete Top 100 final ranking see the complete report.
| Final ranking | Name of the company |
| 1 | SK Innovation |
| 2 | KPIC |
| 3 | Chevron Phillips Chemical |
| 4 | LG Chem |
| 5 | Styrolution |
| 6 | Sinopec |
| 7 | Newmarket Corp. |
| 8 | Borealis |
| 9 | Hanwha Chemical |
| 10 | CEPSA |
Table 2. Final Ranking for the Top 100 Chemical Companies 2019
Examples of the data analysis provided in the complete Report
- Comparison of Turnover / Full Time Equivalent (FTE) & Patents published in 2019 / FTE by region, for the Top 300
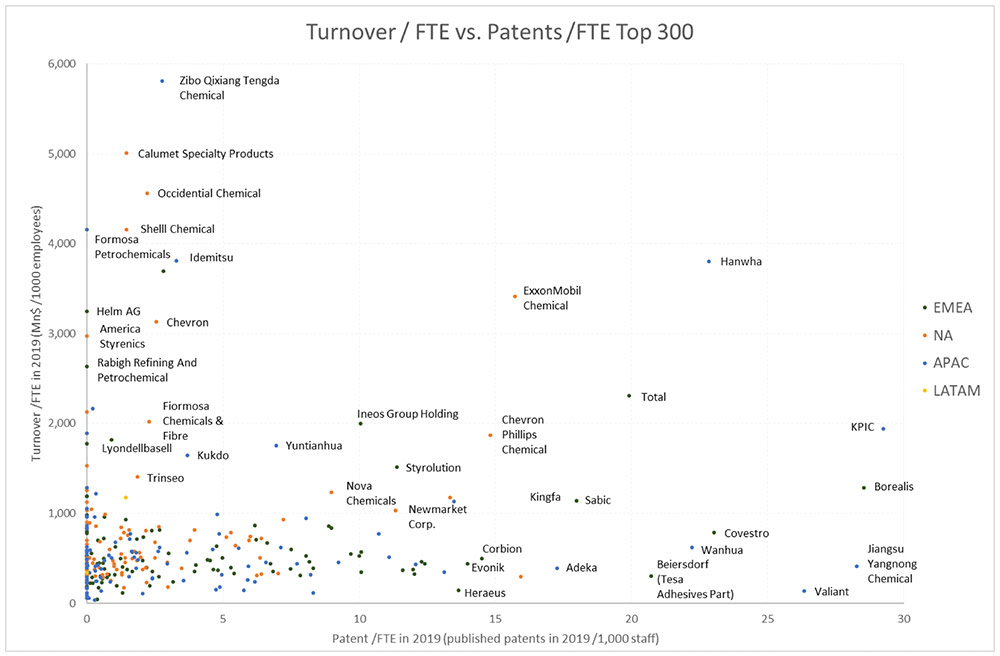
Illustration 1. Performances of Top 300 chemical companies in terms of chemical sales and number of published patents per 1,000 employees in 2019 (includes the companies falling in areas with X-axis (patent/FTE) values of 30 and Y-axis (TO/FTE) values of 6000)
- Comparison of the change in Turnover from Chemical Sales and Changes in R&D Expenditures from 2018 to 2019 by region, for the Top 300
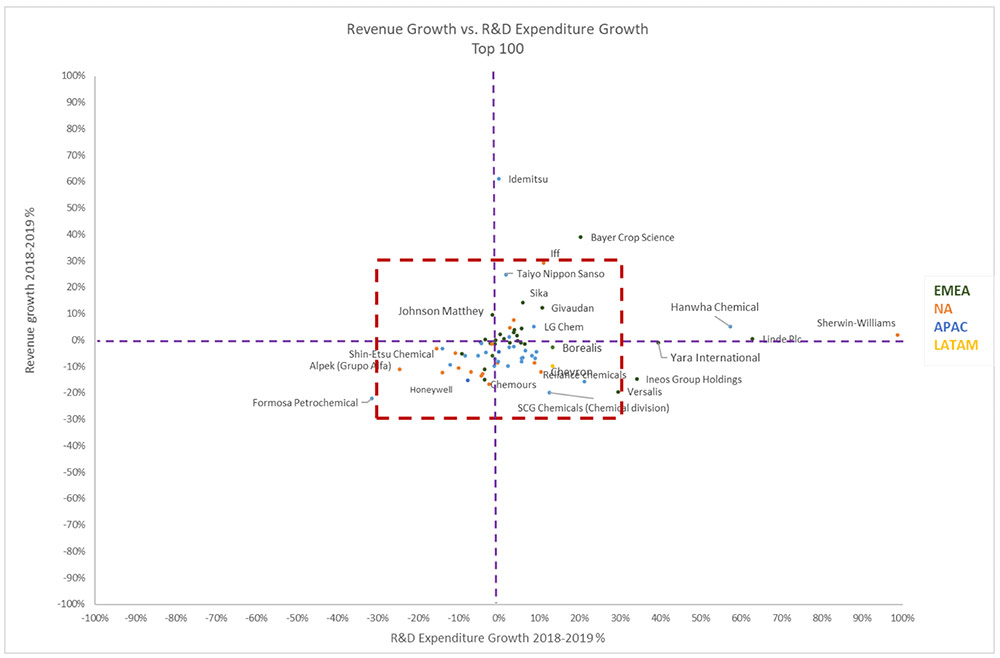
Illustration 2. Analysis of Top 100 revenues and R&D expense. Axes measure percent growth from 2018 into 2019.
- Comparison of the performance of Top 50 companies in 2018 and 2019
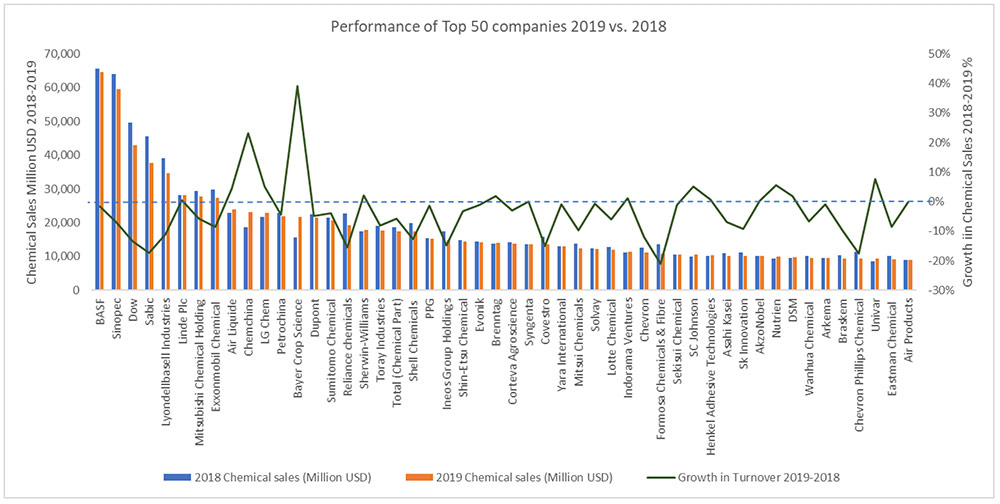
Illustration 3. Analysis of the performance of the Top 50 companies. Comparison of the Chemical-related Sales in 2018 and 2019
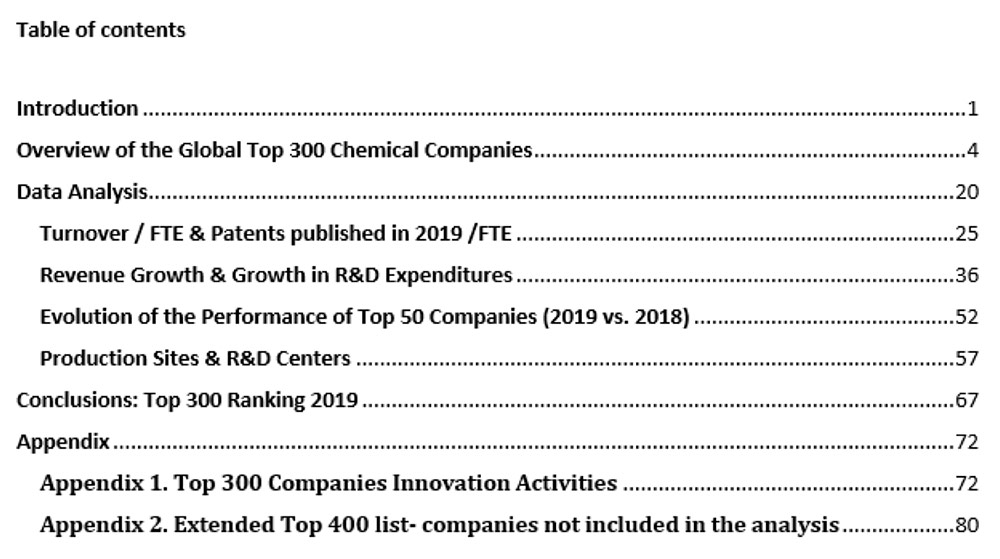
Contents of the Market Report
The table of contents for the complete market report is presented below (total report is 82 pages).
Price and Commercial Options:
Daydream & Dynovel offer three (3) options to purchase the Complete Market Report.
You will find below three (3) options offered by Daydream & Dynovel to purchase the complete market report. Once the payment is processed, you will receive an email notification with the link and password to download the purchased document(s). You will also receive an invoice from Daydream and Dynovel via our payment processing platform (Stripe).
Please contact us for additional information contact@daydream.eu.
For Asia you can also contact siwen.pan@daydream.eu or yusi.chen@daydream.eu
Remember all our publications are under the Personal Data Protection Law available by e-mail to contact@daydream.eu.


